Envision360
Schedule a call
Case Study: Mobile Remote Monitoring & Maintenance App for Off-Grid Solar | Envision360 × Netline Group
Case study

Mobile remote monitoring & maintenance for off-grid solar

Client: Netline Group (Net-Line Pvt. Ltd.), Pakistan. They manage off-grid and hybrid solar sites in areas where connectivity is not consistent. When a site drops, minutes matter, but visibility was delayed.

The goal was clear. Give ops a real-time view, push alerts to the right people, and let partners run maintenance with proof, photos, and status updates. All without turning central ops into a call centre.

Client at a glance

  • Type: turnkey power and solar solutions provider
  • Footprint: rural and semi-urban deployments across Pakistan
  • Focus: off-grid and hybrid for telecom towers, mini-grids, and critical infrastructure

Goal

Real-time site health, faster fault handling, and partner-run maintenance. Enough structure to scale beyond 200 sites without growing the support team at the same rate.

Challenge

Growth exposed the weak spots. Data was delayed, status checks were manual, and fault handling relied too much on phone calls. With more sites, the same issues happened more often.

  • Limited real-time visibility: inverter and BMS status landed late or in pieces
  • Slow fault detection: problems surfaced after partner reports
  • Inefficient maintenance: spreadsheets and calls made coordination messy
  • Support overload: central ops handled repetitive status requests
  • Scaling risk: manual processes would not hold for 200+ sites
Mobile app ticket view and critical site alert workflow
Our solution

Telemetry in, alerts out, field fixes synced.

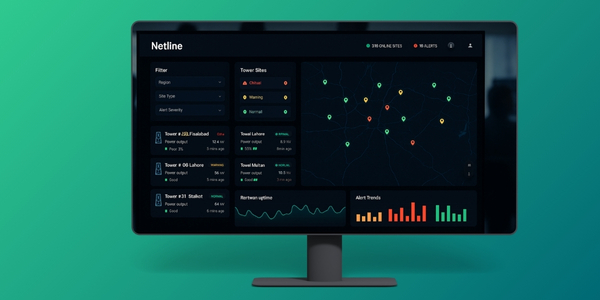
We built a mobile-first remote ops platform that collects telemetry, triggers alerts, and tracks maintenance work end to end. Ops can see what is happening. Partners can acknowledge, fix, and close work with proof.

The system also had to survive low-signal regions. That meant offline-first mobile flows and safe delayed sync.

Telemetry ingestion

Adapters normalized vendor devices into one stream.

  • MQTT, Modbus, and REST sources
  • Offline buffering for low-signal regions

Ops dashboard

A live view that reduces status calls.

  • Map, site drill-downs, and fault history
  • Uptime and alert frequency indicators

Alert engine

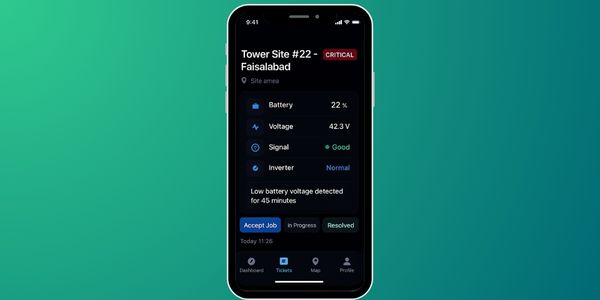
Actionable alerts with acknowledgment.

  • Threshold rules for voltage, comms, and critical failures
  • Push, email, SMS with bi-directional ack

Partner mobile app

Field work stays structured even offline.

  • Job cards, photos, notes, and checklists
  • Offline-first capture with sync on reconnect

Analytics

Find repeat issues and push proactive work.

  • Trend analysis and maintenance recommendations
  • Noise suppression and tuning

RBAC and audit

The right view for ops, partners, and leadership.

  • Role-based access by region and responsibility
  • Audit trail for alerts, actions, and closures
Pilot

Scope and challenges.

We started with a controlled rollout across 50 sites. Different vendors, different firmware versions, and uneven connectivity were the reality. The platform had to normalize data and stay usable when signals dropped.

  • 50 sites across multiple vendors and firmware versions
  • Telemetry mismatches: normalization handled inconsistent streams
  • Connectivity gaps: offline caching and delayed sync
  • Fast onboarding: short training with in-app guidance
Reliability

Alert optimization and data handling.

Early versions triggered too much noise. We tuned thresholds, added suppression logic, and tightened what counts as actionable. The goal was fewer alerts, but better ones.

  • Noise reduction: threshold tuning and suppression
  • Encryption: TLS in transit and encryption at rest
  • Archiving: older telemetry moved to lower-cost storage on a schedule
Technology

Stack and architecture.

The architecture was built around a simple idea. Telemetry is noisy. Workflows cannot be. We separated ingestion, alerting, and user workflows so each layer stays stable as volume grows.

Mobile app

  • iOS and Android
  • Push notifications
  • Offline caching and sync

Backend

  • Event-driven services for alerts and jobs
  • Queueing and caching for reliability

Telemetry

  • MQTT and Modbus support
  • Adapter layer for vendor devices

Web dashboard

  • Real-time site view and drill-downs
  • Live updates for ops teams

Security

  • Role-based access
  • Audit logs for actions
  • Secure APIs for integrations

Cloud

  • Scalable hosting and monitoring
  • CI/CD pipelines for controlled releases
Approach

No stall rollout.

This needed to ship without disrupting active operations. We ran discovery fast, built around real workflows, and used a pilot to tune alerts before scaling.

  • Discover site inventory, protocols, roles, and SLAs
  • Design alert rules, workflows, and permissions
  • Build adapters, dashboards, and partner mobile flows
  • Pilot measure acknowledgment speed, downtime, and noise
  • Scale expand coverage with repeatable playbooks
Impact

After six months.

  • Avg downtime per fault: about 16h to about 9h
  • Reactive support calls: 120+ per month to about 80 per month
  • Fault acknowledgment: about 3h to under 1h
  • Proactive maintenance: about 5% to about 25%
  • Scheduling conflicts: frequent to minimal
  • Ops overhead: high to lower

Real-time visibility plus structured partner workflows let them scale without turning ops into a constant escalation loop.

Outcomes: downtime reduced, fewer calls, faster acknowledgments, more proactive jobs
Schedule a call or contact us to plan your rollout.